R: Plots and graphs

Plotting in R is extremely easy.

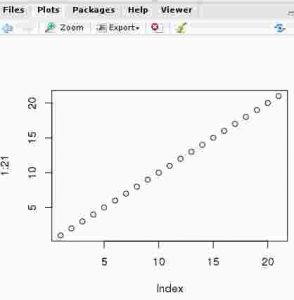
plot (1:21)

rstudio_plotting_000

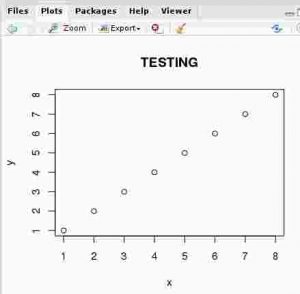
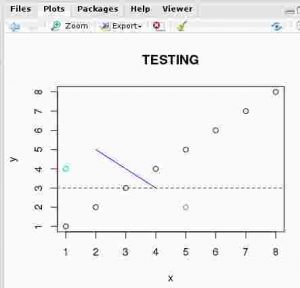
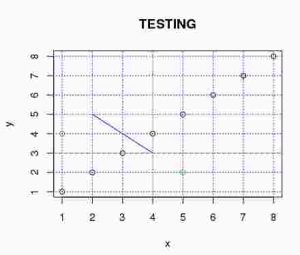
plot (1:8, main="TESTING",xlab="x",ylab="y")

rstudio_plotting_001

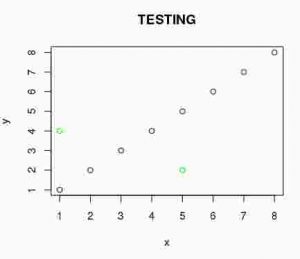
points(c(1,5),c(4,2), col="green")

rstudio_plotting_002

abline(h=3,col="red",lty=2)

rstudio_plotting_003

abline(h=1,col="yellow",lty=2)

rstudio_plotting_004

grid(col="purple")

rstudio_plotting_005

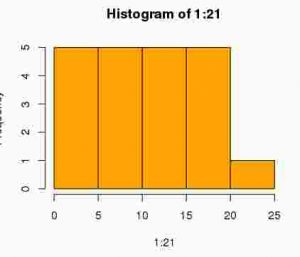
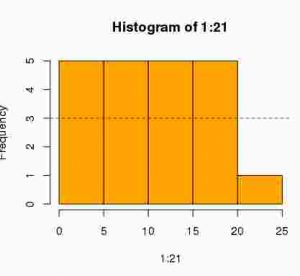
hist (1:21,col="orange")

rstudio_plotting_006

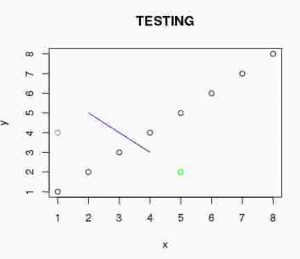
lines(c(2,4),c(5,3),col="blue")

rstudio_plotting_007

abline(h=3,col="red",lty=2)

Exporting and importing graphs

dev.copy(png,'myplot.png')
dev.off()

To list existing colors

> colors()
  [1] "white"                "aliceblue"            "antiquewhite"         "antiquewhite1"       
  [5] "antiquewhite2"        "antiquewhite3"        "antiquewhite4"        "aquamarine"          
  [9] "aquamarine1"          "aquamarine2"          "aquamarine3"          "aquamarine4"         
 [13] "azure"                "azure1"               "azure2"               "azure3"              
(...)
"violetred2"           "violetred3"          
[645] "violetred4"           "wheat"                "wheat1"               "wheat2"              
[649] "wheat3"               "wheat4"               "whitesmoke"           "yellow"              
[653] "yellow1"              "yellow2"              "yellow3"              "yellow4"             
[657] "yellowgreen"

Global changes for styles and colors

Adding texts to plots

text(11,11,"Regular text")

text(11,11, "Bigger text", cex=2)

text(5,5, "serif text", family="serif")

text(3,3 "mono text", family="mono")

text(7,7 "Sans text", family="sans")


Mathematic notation

demo(plotmath)

draw.plotmath.cell(expression(x != y), i, nr); i <- i + 1

> draw.plotmath.cell(expression(x < y), i, nr); i <- i + 1

> draw.plotmath.cell(expression(x <= y), i, nr); i <- i + 1

> draw.plotmath.cell(expression(x > y), i, nr); i <- i + 1

> draw.plotmath.cell(expression(x >= y), i, nr); i <- i + 1

> draw.plotmath.cell(expression(x %~~% y), i, nr); i <- i + 1

> draw.plotmath.cell(expression(x %=~% y), i, nr); i <- i + 1

> draw.plotmath.cell(expression(x %==% y), i, nr); i <- i + 1

> draw.plotmath.cell(expression(x %prop% y), i, nr); i <- i + 1

> draw.plotmath.cell(expression(x %~% y), i, nr); i <- i + 1


Starting with R

Installation of R and R-studio in windows
  • https://cran.rediris.es/bin/windows/base/R-3.2.4revised-win.exe
  • https://download1.rstudio.org/RStudio-0.99.893.exe

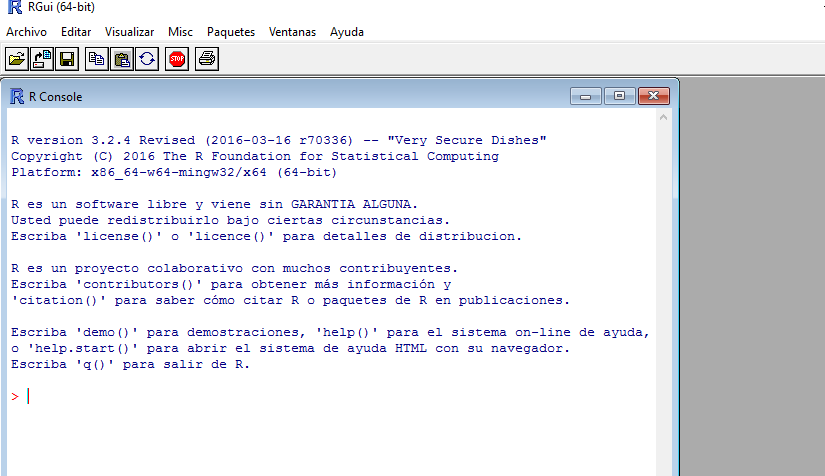
Rconsole:

r.console.001

Proxy settings are configured at invocation command. I will use cygwin to start it:

 /cygdrive/c/Program\ Files/R/R-3.2.4revised/bin/x64/Rgui.exe  http_proxy=http:/localhost:8888/

You can also load values from internet explorer

 /cygdrive/c/Program\ Files/R/R-3.2.4revised/bin/x64/Rgui.exe  --internet2

Rconsole in linux

apt-get install r-recommended libxml2-dev  libcurl4-openssl-dev libssl-dev

wget https://download1.rstudio.org/rstudio-0.99.893-amd64.deb
sudo dpkg -i rstudio-0.99.893-amd64.deb

To Find which session file is freezing rstudio:

strace -f rstudio 2>&1 | grep open | grep home

Help. Sistema de ayuda

Online documentation for every package and function: http://www.rdocumentation.org/

help ("read.table")
?

Vignette the command used to open pdf help docs.

Installing new packages. Instalación de paquetes

To install new packages and dependencies

install.packages("curl", dependencies = TRUE)

To install more than one package at the same time, we can use C to make a vector of packages:

install.packages(c("curl","swirl","httr"), dependencies = TRUE)

Swirl package

Swirl()
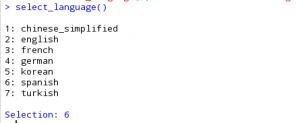
Select_language()

Selección_001

Using and declaring variables.

myval <- 12

R simplest object  is a vector, it can be declared using c (combine)

myval <- c(12,21,2)

Variables value can be printed using print function or just their names:

print(myval) 
myval

To check the objects declared in a session

ls ()

Vectors

Defining a vector with a certain length and type

vector ("numeric", length = 23)

Create a vector with a repeating pattern

(rep(c(TRUE,FALSE),10))
 [1]  TRUE FALSE  TRUE FALSE  TRUE FALSE  TRUE FALSE  TRUE FALSE  TRUE FALSE  TRUE FALSE  TRUE FALSE  TRUE FALSE  TRUE
[20] FALSE

Using a vector to index another vector.Return positions that are multiple of 4:

my_vector[c(FALSE,FALSE,FALSE,TRUE)]

Dates. Fechas

Great tutorial to work with dates: http://www.stat.berkeley.edu/~s133/dates.html

today <- Sys.Date()

Load data from a file

mydata <- read.table("mycommaseparatedvaluefile.csv", header=TRUE, sep=",", fileEncoding = "latin1")
view (Data)


sdf

Introducción a R

Instalación de R y R-studio en windows
  • https://cran.rediris.es/bin/windows/base/R-3.2.4revised-win.exe
  • https://download1.rstudio.org/RStudio-0.99.893.exe


r.console.001

Para la instalación de paquetes, es necesario configurar el proxy. En el ejemplo, se redirige el proxy a un puerto local con fiddler.

 /cygdrive/c/Program\ Files/R/R-3.2.4revised/bin/x64/Rgui.exe  http_proxy=http:/localhost:8888/

También se pueden recoger los valores desde Internet Explorer.

 /cygdrive/c/Program\ Files/R/R-3.2.4revised/bin/x64/Rgui.exe  --internet2

Instalación en linux. Debian 8.

apt-get install r-recommended libxml2-dev  libcurl4-openssl-dev libssl-dev

wget https://download1.rstudio.org/rstudio-0.99.893-amd64.deb
sudo dpkg -i rstudio-0.99.893-amd64.deb

Sistema de ayuda

http://www.rdocumentation.org/

help ("read.table")
?

También existe el comando Vignette para abrir los pdfs de ayuda que vienen integrados.

Instalación de paquetes nuevos

Instalación de nuevos paquetes con dependencias:

install.packages("curl", dependencies = TRUE)

Para instalar más de un paquete al mismo tiempo, se puede usar c (Combinar) con una lista de nombres de paquetes:

install.packages(c("curl","swirl","httr"), dependencies = TRUE)

Swirl package

Swirl()
Select_language()

Selección_001

Declaración de variables.

myval <- 12

Casi todos los datos simples que se van a usar, serán vectores.

myval <- c(12,21,2)

Para ver el valor, basta con usar print o poner el nombre del valor.

print(myval) 
myval

Los objetos existen en una memoria de sesión que se pueden consultar mediante el uso de ls.

ls ()

Vectores

Para definir un vector de tipo numérico con longitud determinada:

vector ("numeric", length = 23)

A los vectores se les puede asignar valores de inicio, con patrones repetitivos

(rep(c(TRUE,FALSE),10))
 [1]  TRUE FALSE  TRUE FALSE  TRUE FALSE  TRUE FALSE  TRUE FALSE  TRUE FALSE  TRUE FALSE  TRUE FALSE  TRUE FALSE  TRUE
[20] FALSE

También se puede usar un vector para acceder a los valores de dentro del propio vector. En el ejemplo, se imprimirán por pantalla los valores que estén en posiciones múltiplos de 4.

my_vector[c(FALSE,FALSE,FALSE,TRUE)]

Fechas

http://www.stat.berkeley.edu/~s133/dates.html

today <- Sys.Date()

Leer un archivo:

mydata <- read.table("mycommaseparatedvaluefile.csv", header=TRUE, sep=",", fileEncoding = "latin1")
view (Data)