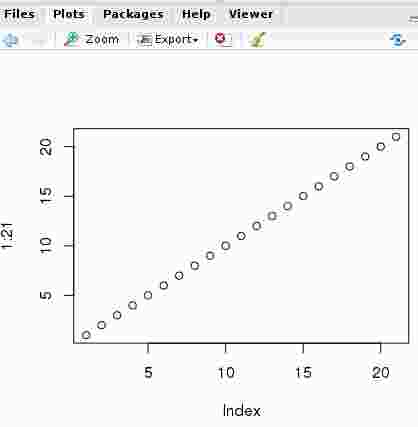
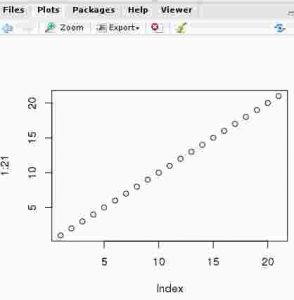
Plotting in R is extremely easy.
plot (1:21)
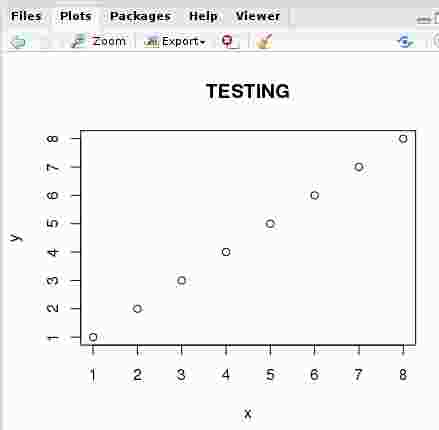
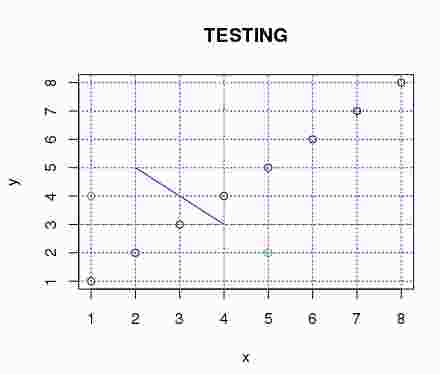
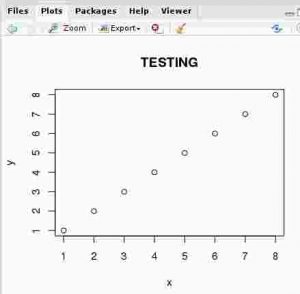
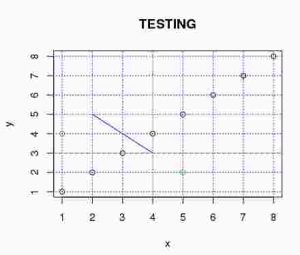
plot (1:8, main="TESTING",xlab="x",ylab="y")
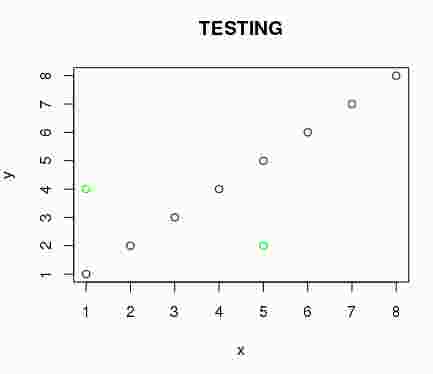
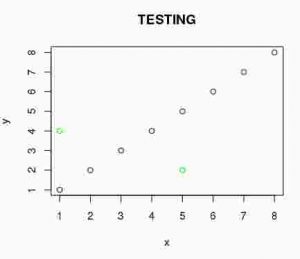
points(c(1,5),c(4,2), col="green")
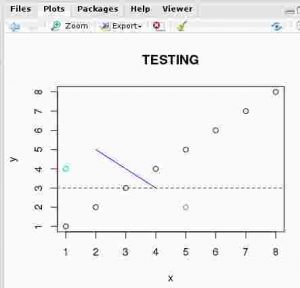
abline(h=3,col="red",lty=2)
abline(h=1,col="yellow",lty=2)
grid(col="purple")
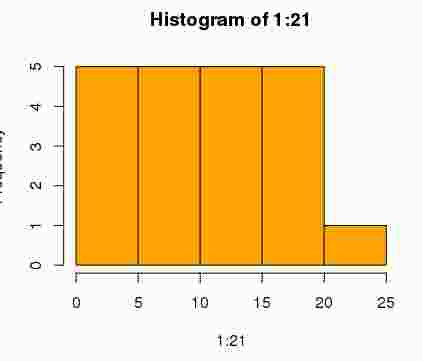
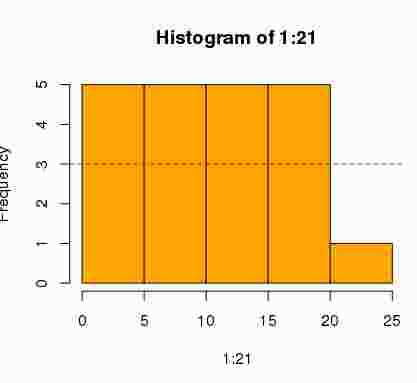
hist (1:21,col="orange")

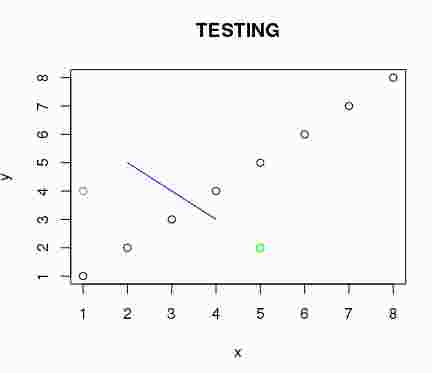
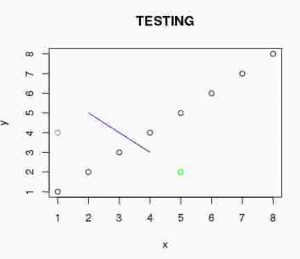
lines(c(2,4),c(5,3),col="blue")

abline(h=3,col="red",lty=2)
Exporting and importing graphs
dev.copy(png,'myplot.png')
dev.off()
To list existing colors
> colors()
  [1] "white"                "aliceblue"            "antiquewhite"         "antiquewhite1"
  [5] "antiquewhite2"        "antiquewhite3"        "antiquewhite4"        "aquamarine"
  [9] "aquamarine1"          "aquamarine2"          "aquamarine3"          "aquamarine4"
 [13] "azure"                "azure1"               "azure2"               "azure3"
(...)
"violetred2"           "violetred3"
[645] "violetred4"           "wheat"                "wheat1"               "wheat2"
[649] "wheat3"               "wheat4"               "whitesmoke"           "yellow"
[653] "yellow1"              "yellow2"              "yellow3"              "yellow4"
[657] "yellowgreen"
Global changes for styles and colors
Adding texts to plots
text(11,11,"Regular text")

text(11,11, "Bigger text", cex=2)

text(5,5, "serif text", family="serif")

text(3,3 "mono text", family="mono")

text(7,7 "Sans text", family="sans")
Mathematic notation
demo(plotmath)

draw.plotmath.cell(expression(x != y), i, nr); i <- i + 1

> draw.plotmath.cell(expression(x < y), i, nr); i <- i + 1

> draw.plotmath.cell(expression(x <= y), i, nr); i <- i + 1

> draw.plotmath.cell(expression(x > y), i, nr); i <- i + 1

> draw.plotmath.cell(expression(x >= y), i, nr); i <- i + 1

> draw.plotmath.cell(expression(x %~~% y), i, nr); i <- i + 1

> draw.plotmath.cell(expression(x %=~% y), i, nr); i <- i + 1

> draw.plotmath.cell(expression(x %==% y), i, nr); i <- i + 1

> draw.plotmath.cell(expression(x %prop% y), i, nr); i <- i + 1

> draw.plotmath.cell(expression(x %~% y), i, nr); i <- i + 1


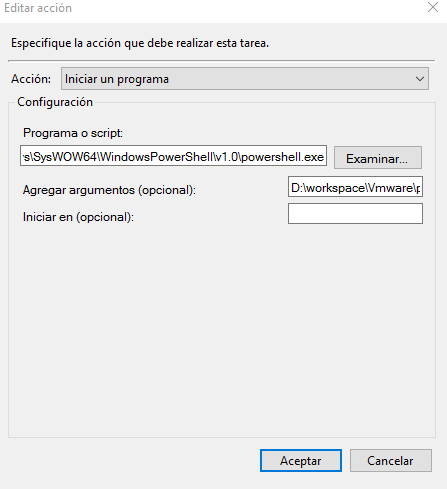
 Poner ruta de powershell y del script de powercli completa: