Simple logging en python.

Tras muchas idas y venidas con la gestión de logs en python, he llegado a este tutorial de python que resume bastante bien la gestión más básica que se puede hacer en una aplicación con los logs:
En mi caso, los requisitos son:
– El log se guarda en fichero.
– El fichero debe rotar.
– Desde cualquier clase del workspace se puede acceder al log

import logging
import logging.handlers as handlers
 
# Se le puede poner cualquier nombre

logger = logging.getLogger(‘mi_app_name’)
logger.setLevel(logging.INFO)


#Log handler to file:
logHandler = handlers.RotatingFileHandler(‘mi_archivo_salida.log’, maxBytes=1000, backupCount=2)
logHandler.setLevel(logging.INFO)
# output format
formatter = logging.Formatter(‘%(asctime)s – %(name)s – %(levelname)s – %(message)s’)
logHandler.setFormatter(formatter)


logger.addHandler(logHandler)


# Comprobar que todos los logs van al mismo fichero:
logger.info(“Primer mensaje al log de tipo INFO”)
logger.error(“Primer mensaje al log de tipo ERROR”)
En cada clase que se vaya a usar el log, se instancia en el init, y luego se usa como un atributo de la clase:

class ejemplo:
“”” Clase de ejemplo para ver el log “””


def __init__(self):
“””Inicializa el objeto “””
self.logger = logging.getLogger(‘mi_app_name’) # Configurar el log.
 
     def metodo1. (self):
“”” Metodo 1 “””

self.logger.info(‘Mensaje de ejemplo 1’)


Para saber mucho más sobre los logs en python: https://docs.python.org/3/howto/logging-cookbook.html

R: Plots and graphs

Plotting in R is extremely easy.

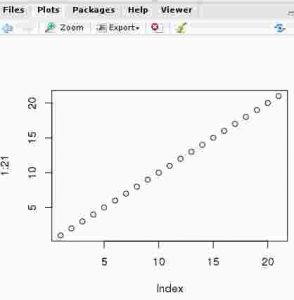
plot (1:21)

rstudio_plotting_000

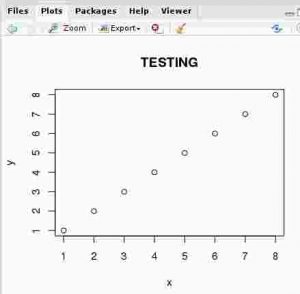
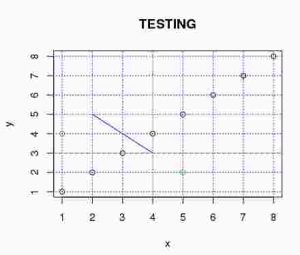
plot (1:8, main="TESTING",xlab="x",ylab="y")

rstudio_plotting_001

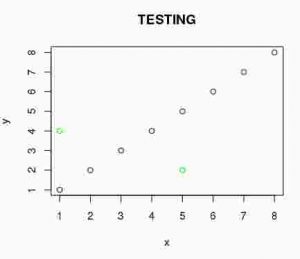
points(c(1,5),c(4,2), col="green")

rstudio_plotting_002

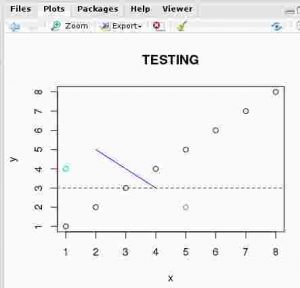
abline(h=3,col="red",lty=2)

rstudio_plotting_003

abline(h=1,col="yellow",lty=2)

rstudio_plotting_004

grid(col="purple")

rstudio_plotting_005

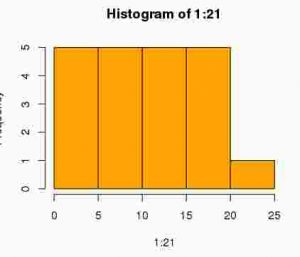
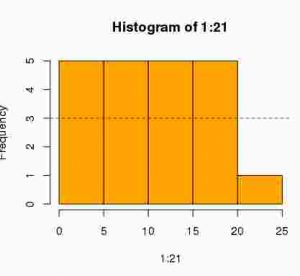
hist (1:21,col="orange")

rstudio_plotting_006

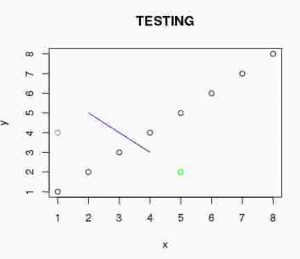
lines(c(2,4),c(5,3),col="blue")

rstudio_plotting_007

abline(h=3,col="red",lty=2)

Exporting and importing graphs

dev.copy(png,'myplot.png')
dev.off()

To list existing colors

> colors()
  [1] "white"                "aliceblue"            "antiquewhite"         "antiquewhite1"       
  [5] "antiquewhite2"        "antiquewhite3"        "antiquewhite4"        "aquamarine"          
  [9] "aquamarine1"          "aquamarine2"          "aquamarine3"          "aquamarine4"         
 [13] "azure"                "azure1"               "azure2"               "azure3"              
(...)
"violetred2"           "violetred3"          
[645] "violetred4"           "wheat"                "wheat1"               "wheat2"              
[649] "wheat3"               "wheat4"               "whitesmoke"           "yellow"              
[653] "yellow1"              "yellow2"              "yellow3"              "yellow4"             
[657] "yellowgreen"

Global changes for styles and colors

Adding texts to plots

text(11,11,"Regular text")

text(11,11, "Bigger text", cex=2)

text(5,5, "serif text", family="serif")

text(3,3 "mono text", family="mono")

text(7,7 "Sans text", family="sans")


Mathematic notation

demo(plotmath)

draw.plotmath.cell(expression(x != y), i, nr); i <- i + 1

> draw.plotmath.cell(expression(x < y), i, nr); i <- i + 1

> draw.plotmath.cell(expression(x <= y), i, nr); i <- i + 1

> draw.plotmath.cell(expression(x > y), i, nr); i <- i + 1

> draw.plotmath.cell(expression(x >= y), i, nr); i <- i + 1

> draw.plotmath.cell(expression(x %~~% y), i, nr); i <- i + 1

> draw.plotmath.cell(expression(x %=~% y), i, nr); i <- i + 1

> draw.plotmath.cell(expression(x %==% y), i, nr); i <- i + 1

> draw.plotmath.cell(expression(x %prop% y), i, nr); i <- i + 1

> draw.plotmath.cell(expression(x %~% y), i, nr); i <- i + 1